


Your board asked about AI risk again. You presented shadow AI discovery numbers. The response was polite, but nothing changed. There was no budget allocation, no urgency, and no decision.
The problem isn’t board apathy. Today, 84% of board members identify cybersecurity as a business risk” (Gartner Board of Directors Survey, 2024). The problem is translation. “We discovered 47 unauthorized AI tools” doesn’t map to capital allocation. However, “$8.4M in exposure through 47 AI tools accessing customer PII” does.
The communication breakdown is structural, not personal. CISOs report what security tools are designed to measure: tools discovered, policies violated, and threats blocked. Boards, in contrast, allocate capital based on financial indicators such as dollar exposure, trend trajectory, and return on investment.
Many security leaders report feeling pressure from the boardroom to downplay the severity of AI and cybersecurity risks, with approximately 79% reporting this pressure in recent surveys.
But understatement is not the real problem. The bigger issue is the use of metrics that fail to register with the board. Slides filled with tool counts and compliance percentages do not minimize AI risk. They make it invisible by burying it in operational detail that boards are not equipped to interpret or act on.
Many CISOs report that board engagement breaks down once risk discussions begin. Research shows that 34% say their boards dismiss warnings out of hand, while 41% worry about being perceived as repetitive or nagging when raising security concerns. The result is predictable: AI risk continues to grow quietly as board presentations repeat formats that fail to trigger action.
Board-ready metrics share three essential characteristics. Without all three, the metric loses decision-making value.
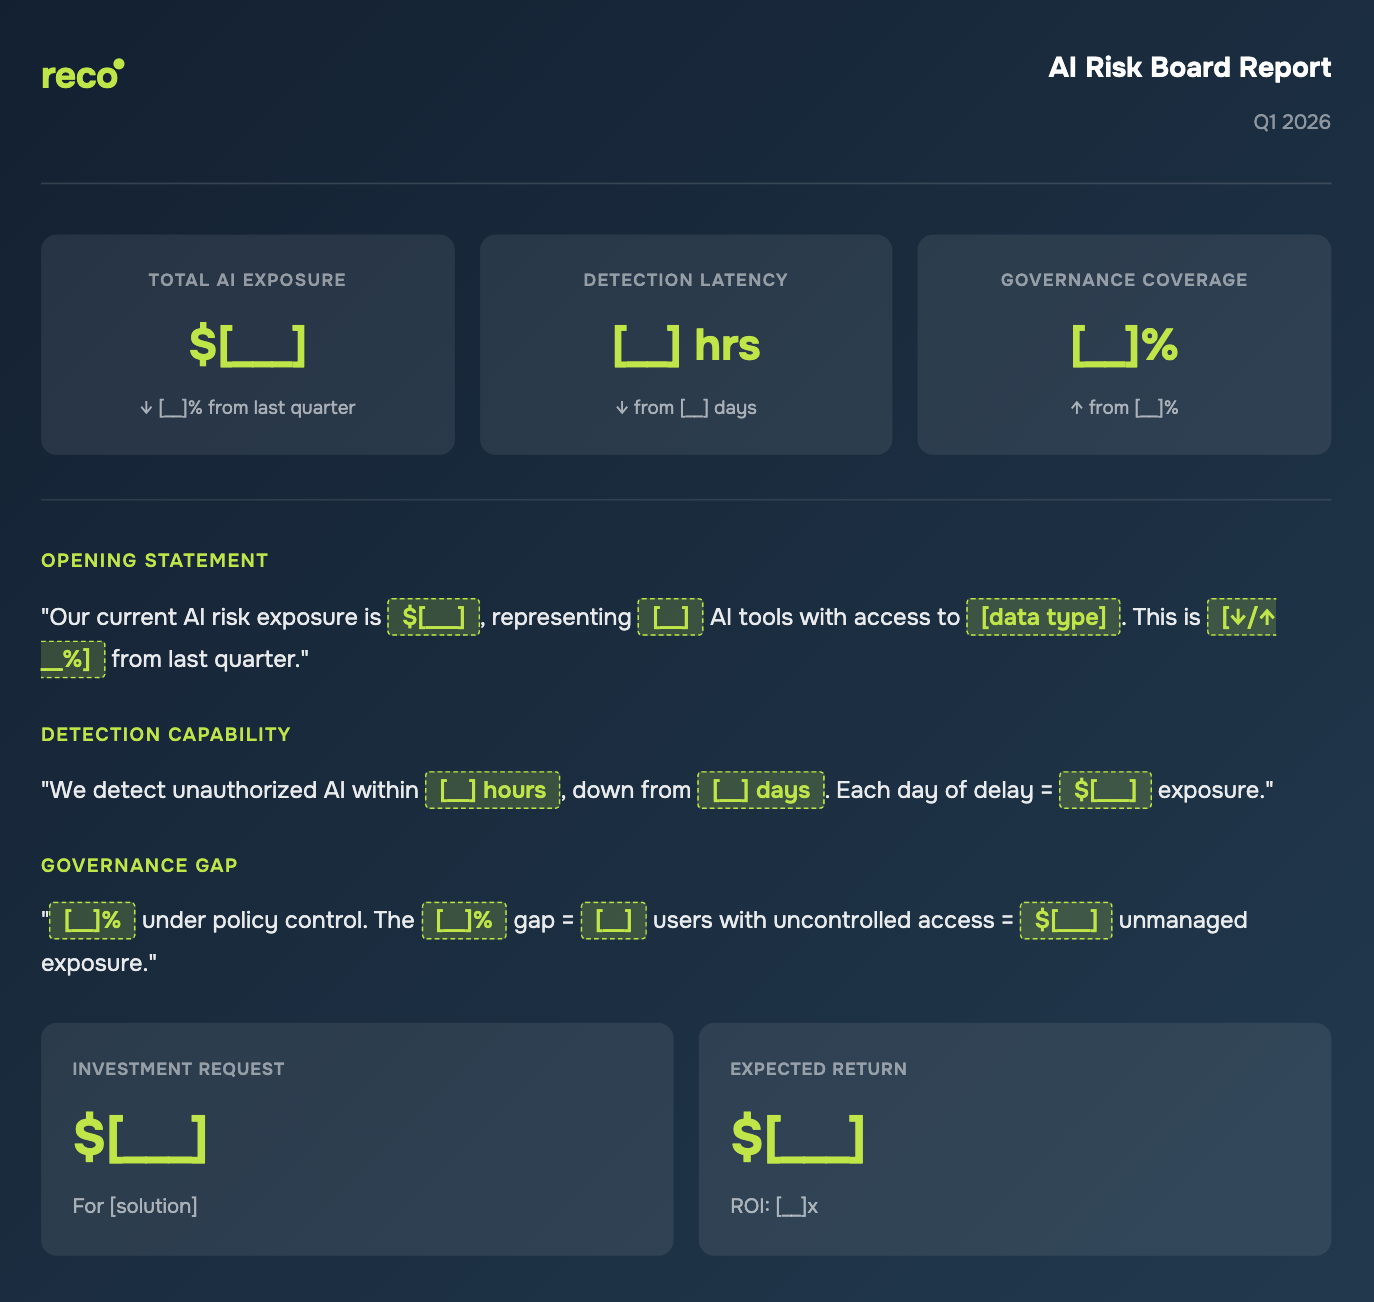
The template below incorporates all three components into every section. No metric is presented without a dollar value, a clear trend comparison, and a defined decision point.
This format works because it mirrors how boards evaluate capital requests: current state, trend, required investment, and expected return. Security decisions should follow the same structure.
Copy this prompt, fill in your data, and paste it into ChatGPT/Claude. Get a board-ready report in seconds.
Generate a board-ready AI risk report using this data:

## My Data
- Total AI tools discovered: [YOUR NUMBER]
- AI tools under governance: [YOUR NUMBER]
- Data types accessible by AI: [e.g., customer PII, financial records]
- Records accessible: [YOUR NUMBER]
- Current detection time for new AI tools: [YOUR NUMBER] days
- Last quarter's exposure: $[YOUR NUMBER]
- Requested investment: $[YOUR NUMBER]
- Solution/capability needed: [YOUR DESCRIPTION]

## Output Format
Create a concise board report with:

1. **Executive Summary** (4 metrics)
   - Total AI Exposure: (records accessible × $160) + $670K if shadow AI present
   - Detection Latency: [current] → target 2 hours
   - Governance Coverage: [tools under governance ÷ total tools × 100]%
   - LLM Prompt Template Calculation: records × $160 + $670K if shadow AI present

2. **Opening Statement** (2 sentences)
   "Our AI risk exposure is $X, representing Y AI tools with access to [data type]. This is [↓/↑]% from last quarter."

3. **Detection Capability** (1 sentence)
   "We detect unauthorized AI within X hours, down from Y days. Each day of delay = $Z exposure."

4. **Governance Gap** (1 sentence)
   "X% under policy. The Y% gap = Z users with uncontrolled access = $W unmanaged exposure."

5. **Decision Point**
   - Investment: $[amount] for [solution]
   - Return: $[exposure reduction]
   - ROI: [X]x

6. **60-Second Pitch**
   Four sentences combining all the above into a single statement.


Keep it under 200 words total. No jargon. Dollar values for everything.
Breach cost basis: IBM Cost of a Data Breach Report 2025 ($160/record customer PII, $670K shadow AI premium)
If a metric lacks a dollar value and a clear decision point, it should be excluded. The following examples illustrate metrics that fail to support board-level decision-making.
Filling this template requires visibility into which AI tools can access which data across the environment. Reco’s Knowledge Graph provides this by mapping AI tools to data access through OAuth monitoring.
When an employee grants an AI tool access, the connection becomes visible within minutes, along with insight into the corporate data the tool can access. Instead of reporting “47 tools discovered,” security teams can report “47 tools with access to customer PII, representing $X in exposure.” This shifts discovery from raw counts to quantified risk aligned with board expectations.

%201.svg)
Gal is the Cofounder & CPO of Reco. Gal is a former Lieutenant Colonel in the Israeli Prime Minister's Office. He is a tech enthusiast, with a background of Security Researcher and Hacker. Gal has led teams in multiple cybersecurity areas with an expertise in the human element.


%201.svg)


.svg)